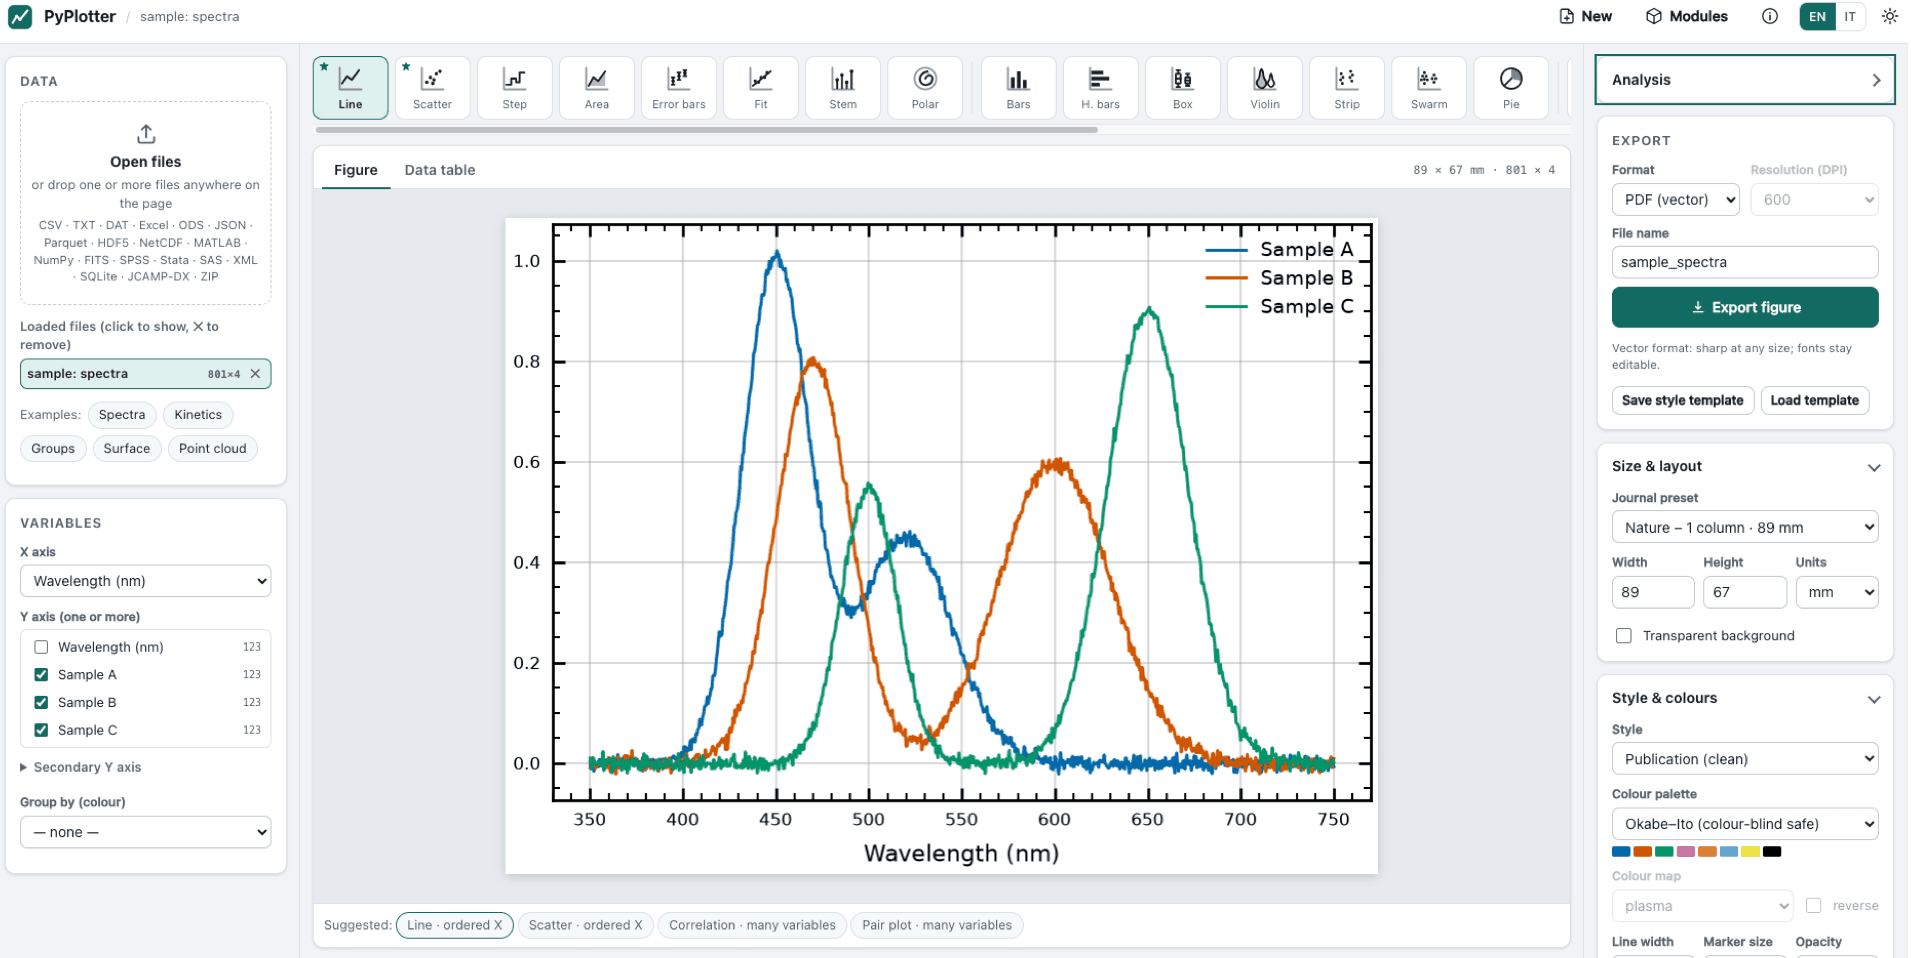
Publication-quality plots from almost any data file, in your browser. PyPlotter is a local app: you open a file, it suggests the right plot, and you export a figure ready for a journal — exact size in mm, vector PDF/SVG/EPS with editable text, or PNG/TIFF up to 1200 DPI. The figures are drawn by the scientific Python stack (Matplotlib, NumPy, pandas), and fitting and statistics come from SciPy and statsmodels, each result with the reference to cite.
Highlights
Opens almost anything — CSV/TSV/TXT/DAT with separator, decimal comma, header and encoding detected automatically, plus Excel, LibreOffice, JSON, Parquet, Feather, HDF5, NetCDF, MATLAB .mat, NumPy, FITS, SPSS, Stata, SAS, XML, HTML tables, SQLite, JCAMP-DX spectra, compressed files and ZIP.
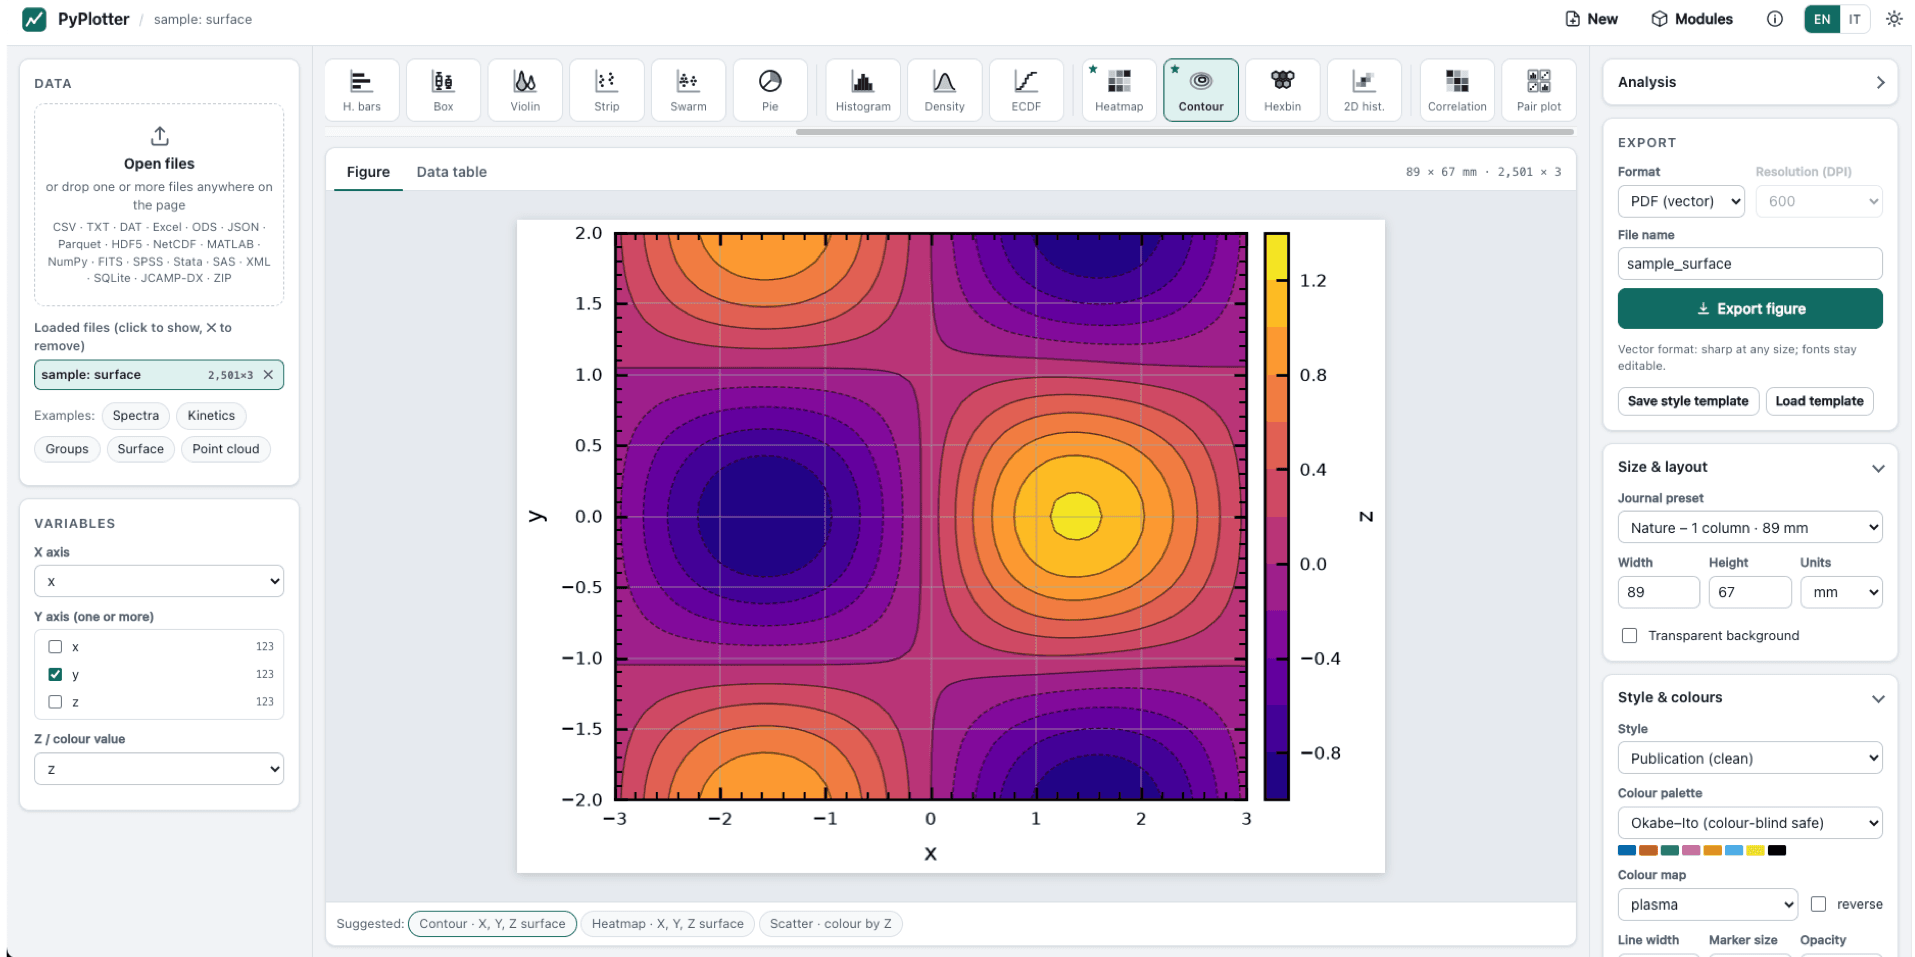
Suggests the right plot from the column types, among 24 plot types: line, scatter, error bars, fits with equation and R², bars, box, violin, histogram, KDE, ECDF, heat map, contour, correlation matrix, pair plot, and more; secondary Y axis.
Publication-ready output — journal column presets, styles (SciencePlots, seaborn-like, ggplot), colour-blind-safe palettes and Crameri colour maps, LaTeX-style math, and an interactive HTML export. The Python script export (data + settings + script + references) rebuilds the figure without PyPlotter.
Recipes — ready-made analysis paths that answer in plain words: Gaussian distribution of a column, Mean of a time series and Equilibration of a simulation (for MD / Monte Carlo data), Are the groups different?, Relation between two variables, Peak fit, Reaction kinetics.
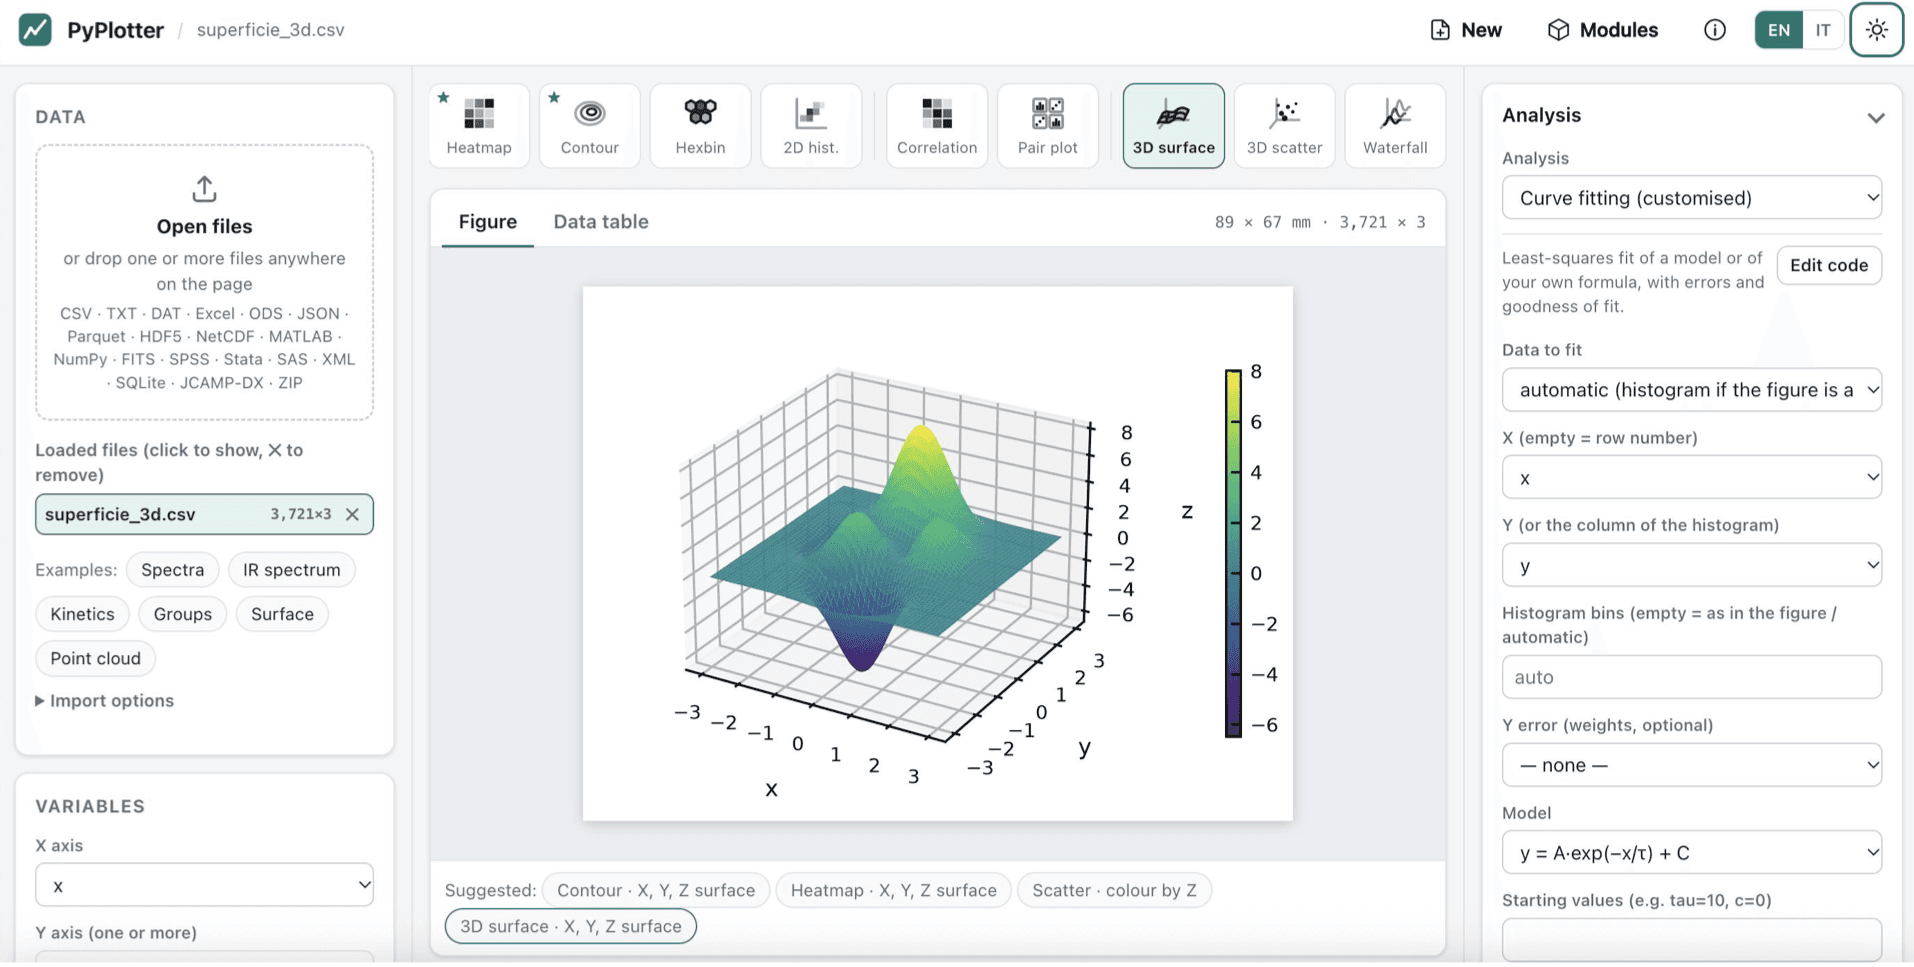
Analysis panel with 14 analyses: curve fitting (15 models or your own formula, weighted by an error column, also on the histogram of a column), autocorrelation and block averaging, normality tests, group comparisons, correlation, linear models, distribution fitting, smoothing, power spectrum, peaks and integrals. Results are drawn on a copy of the figure; the original is never changed.
Several files in one figure, overlaid or one panel per file with letters (a), (b)…. Wide tables with tens of thousands of columns: All / None, a filter that takes ranges (19600-19840, #1-500), Shift+click to tick a block, and heat maps that draw every column. Your own analyses as Python plugins, written in the in-app editor (see PLUGINS.md).
Getting started:
Install Python 3.10 or newer (on Windows, tick Add python.exe to PATH).
Download this release (Source code, zip or tar.gz) and unpack it.
Start PyPlotter:
macOS: double-click start_pyplotter.command (first time: right-click › Open › Open); Windows: double-click start_pyplotter.bat; Linux or any system: python3 start_pyplotter.py. The browser opens at http://127.0.0.1:8770.
On the first start, one button installs NumPy, pandas and Matplotlib into PyPlotter's own environment (.venv); your system Python is not touched. Optional modules (SciPy, statsmodels, Excel and HDF5 readers, Plotly…) are offered when a feature needs them.
Screenshots
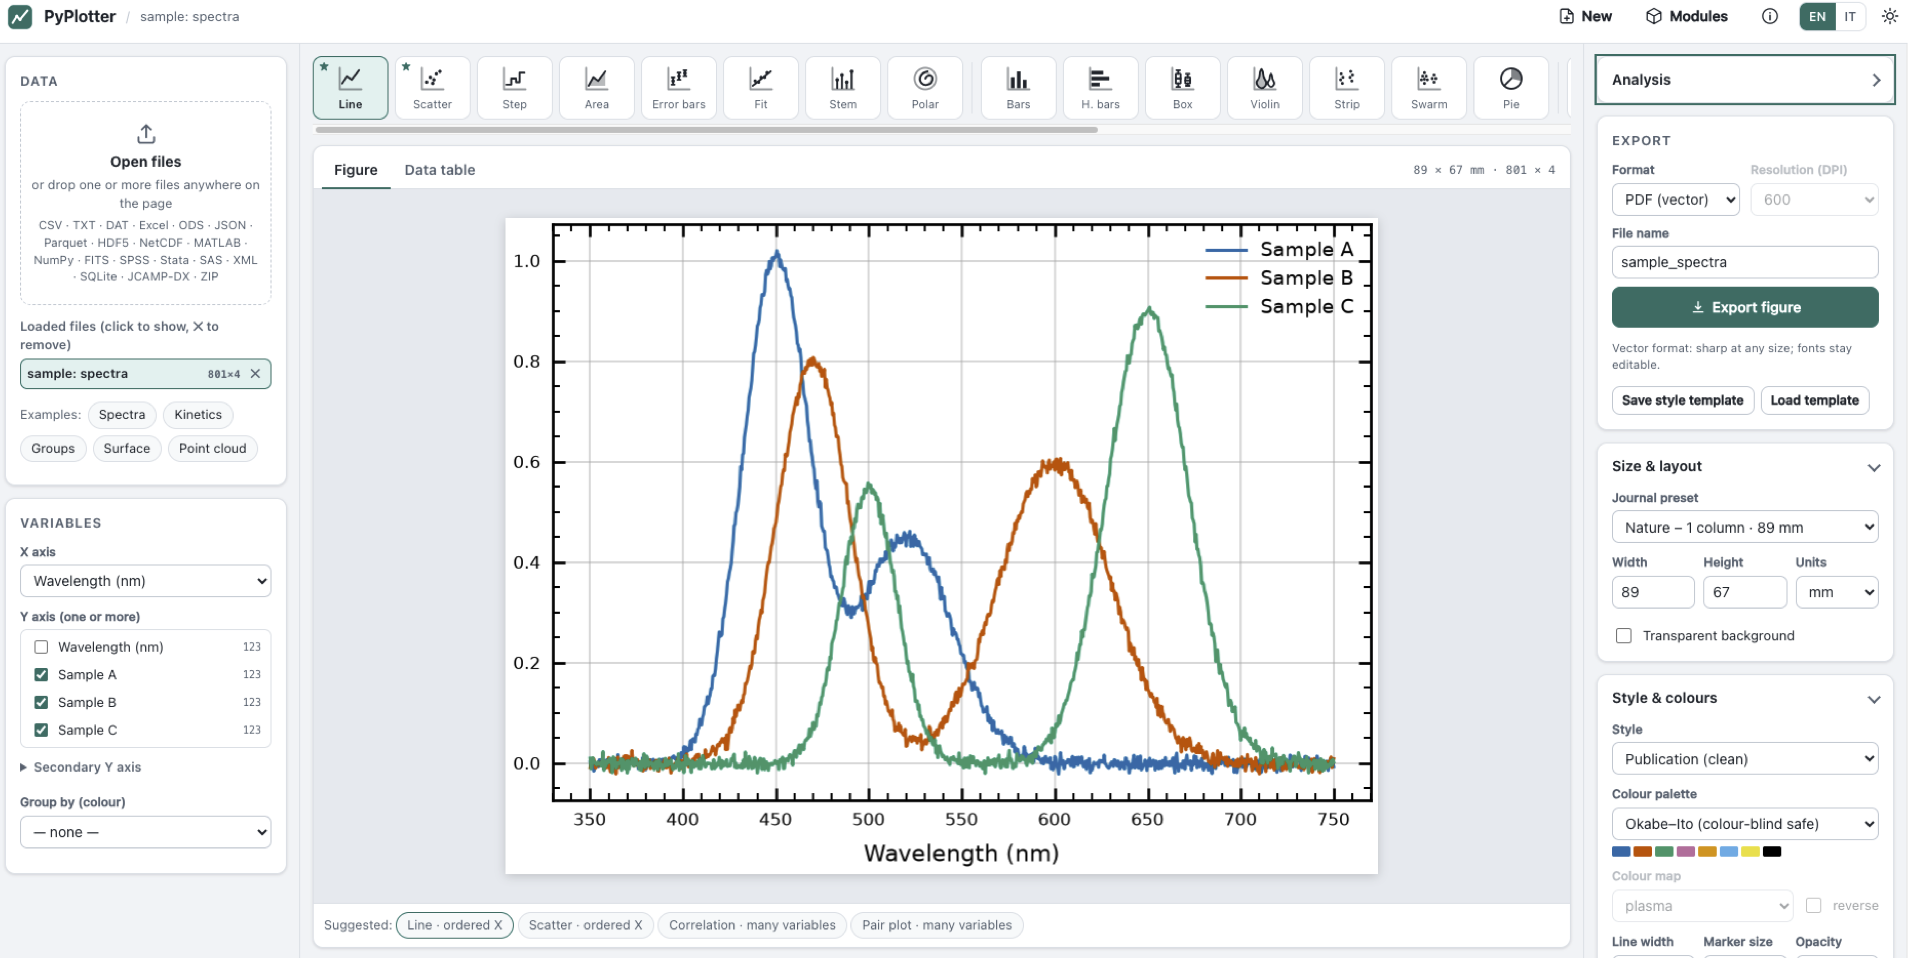
Spectra Analysis
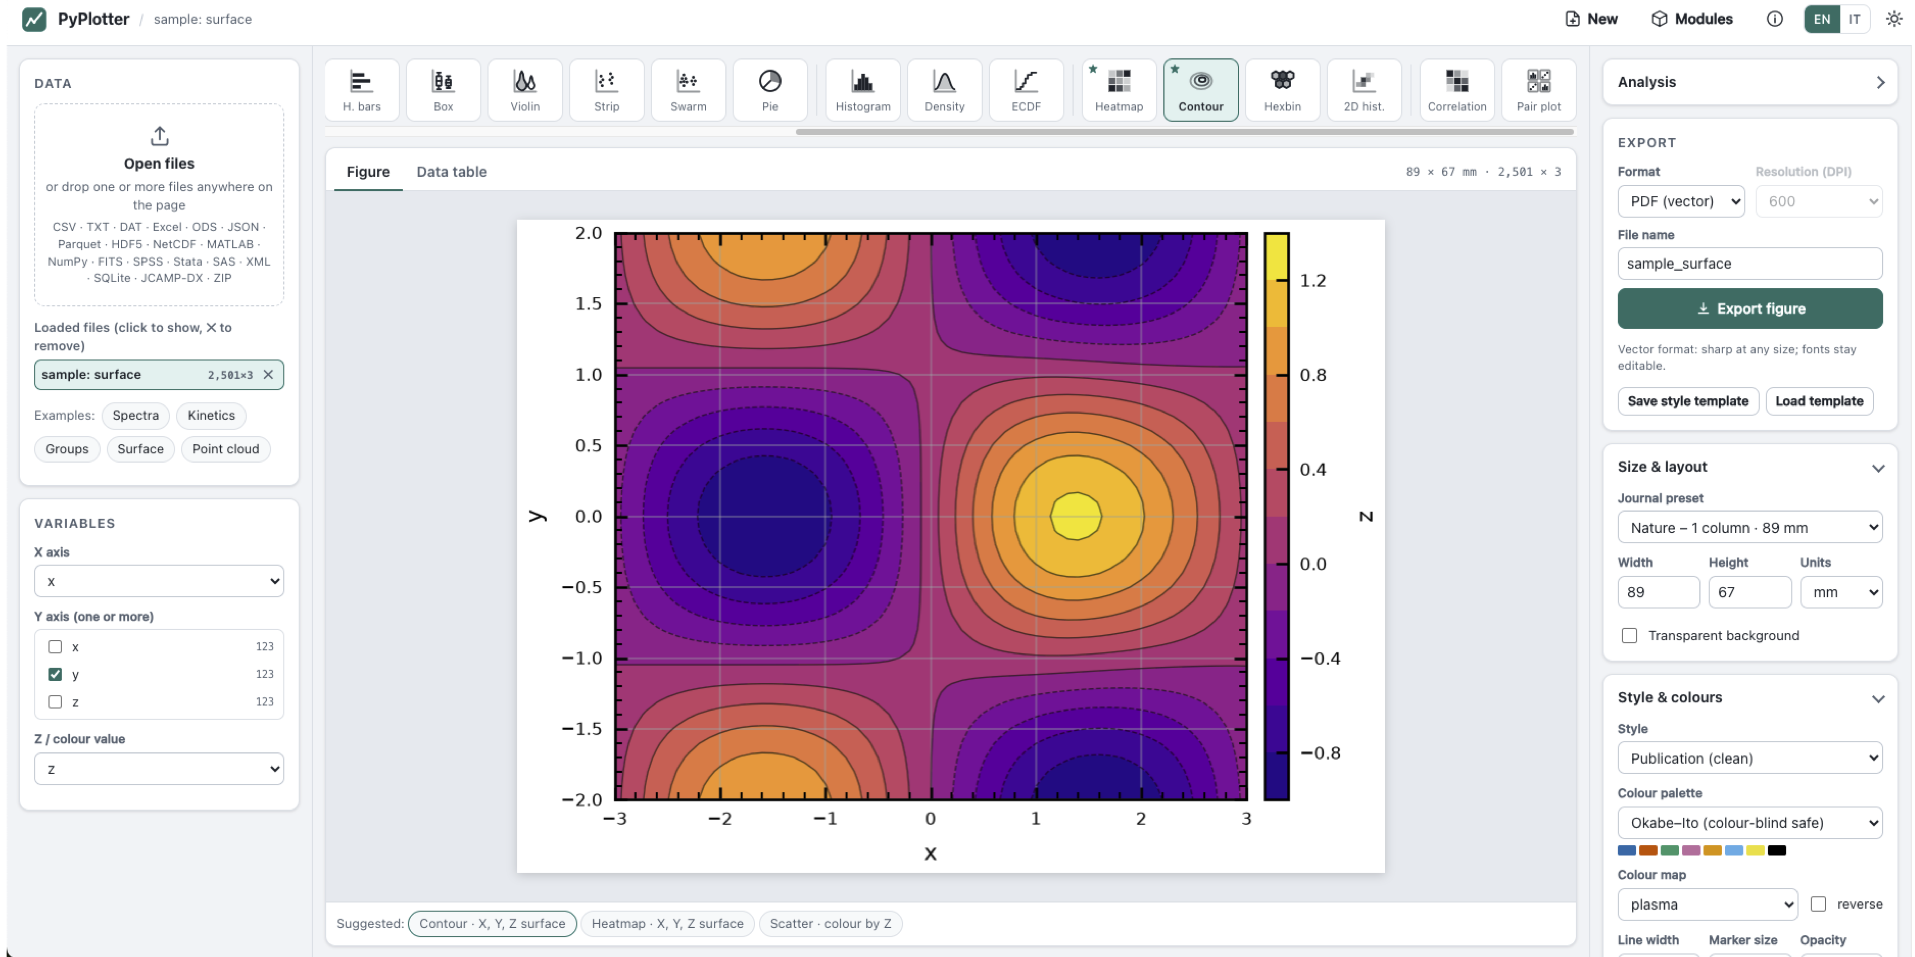
Contour Plot
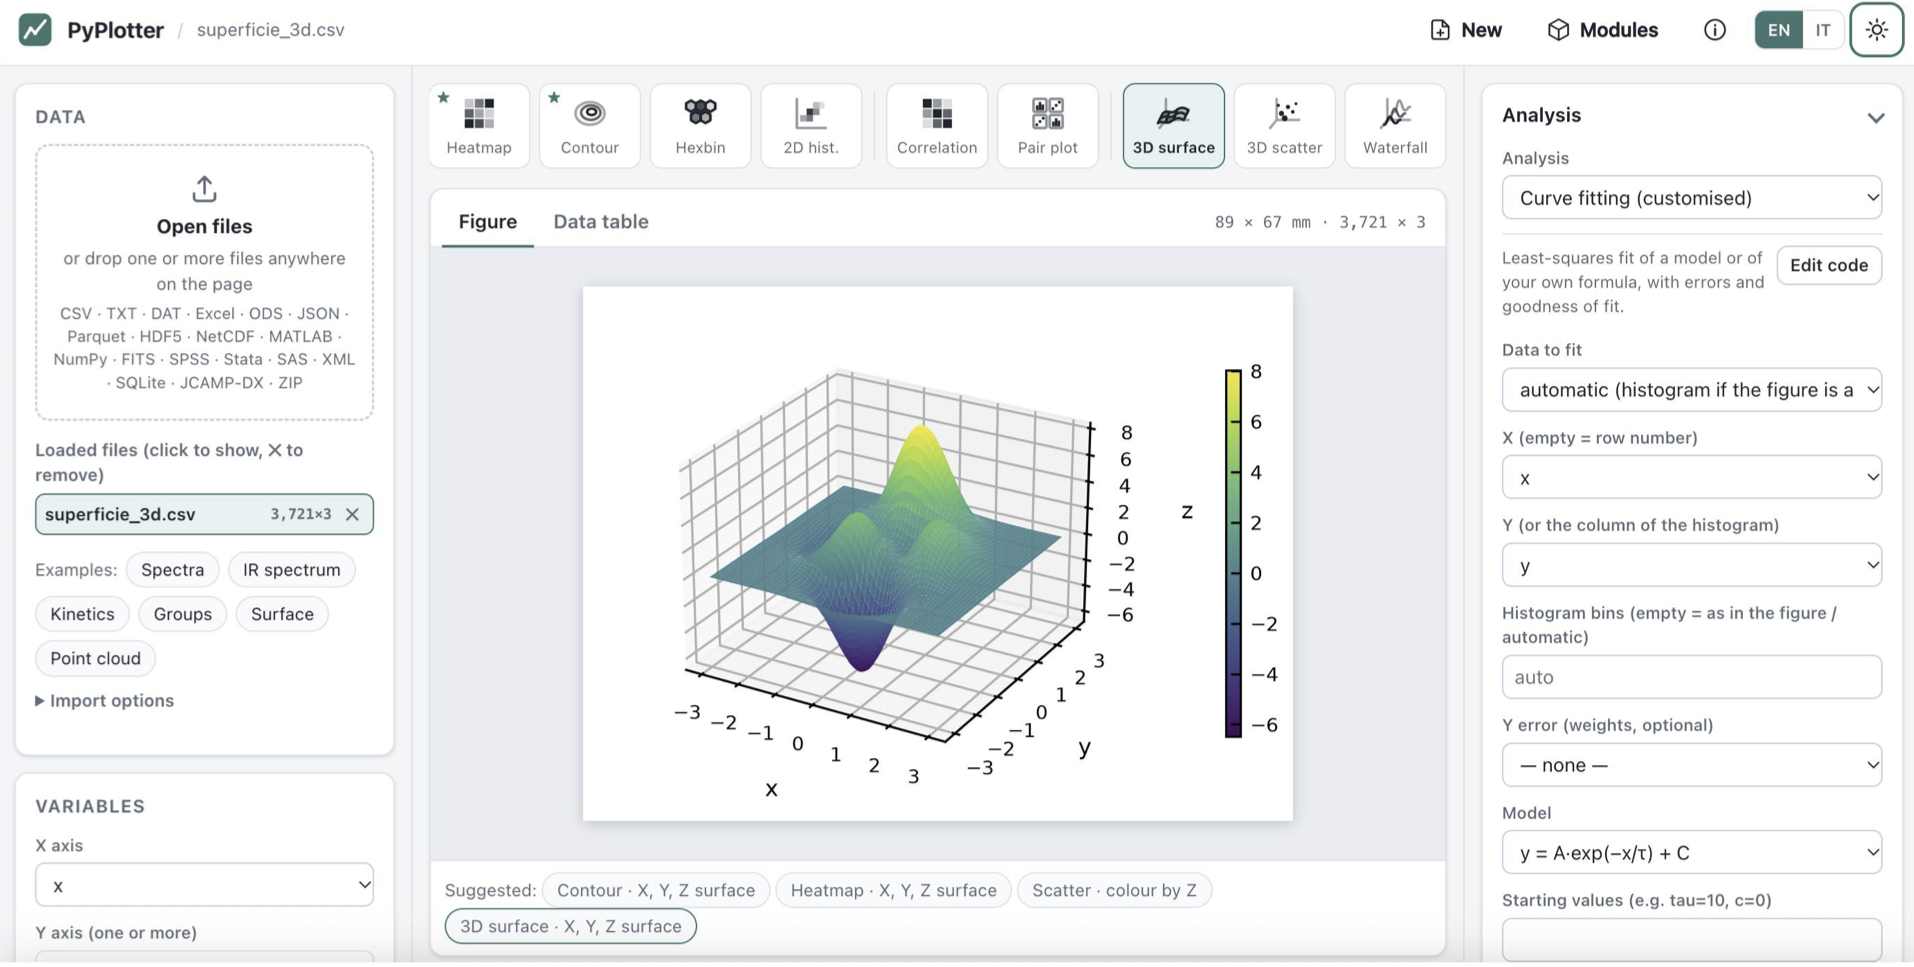
3D Plots
Updates
v0.2.12
- Python script export of contour, 3D surface, matrix heat maps and long lines. The .zip shipped the renderer without two of the modules it uses, so python make_figure.py stopped with "attempted relative import" for contour and 3D surface plots, heat maps of a matrix table and lines of more than 100 000 points. The bundle now carries them.
- Confidence band of a fit when a parameter is at or near 0. The band is computed by numerical derivatives; their step was proportional to the parameter's value, so a parameter at 0 (an intercept, a baseline held at 0) got a step too small to change the curve and its uncertainty dropped out of the band. The step now follows the parameter's standard error when its value is near 0. Bands of other fits are unchanged.
- UTF-8 text files over 256 KB read as cp1252. The format is detected on the first 256 KB; when that sample ended in the middle of a character (°, µ, accented letters), UTF-8 was rejected and the whole file read as cp1252: "°C" became "°C". The sample now ends at a line break.
- Density curve (KDE) of a constant group. A group whose values were all equal, or spanned less than about two bandwidths, stopped the figure with "x and y must have same first dimension". Its curve is now drawn: a narrow peak at that value.
and much more!
How to cite
Francese, Tommaso (2026). PyPlotter: publication-quality plots from any data file (v0.1.0) [Software]. Zenodo. https://doi.org/10.5281/zenodo.23185543
BibTeX
@software{francese_2026_23185543,
  author    = {Francese, Tommaso},
  title     = {PyPlotter: publication-quality plots from any data file},
  year      = {2026},
  publisher = {Zenodo},
  version   = {v0.1.0},
  doi       = {10.5281/zenodo.23185543},
  url       = {https://doi.org/10.5281/zenodo.23185543}
}
Last updated
Become a catalyst
Free tools stay free. A donation lowers the activation energy of the next release.